

How to set up quality, cost, and latency alerts for AI agents
AI agents can return successful HTTP responses even as answer quality declines, token spend grows, or response times increase. These regressions often surface through customer complaints or unexpected invoices because uptime and error dashboards do not measure the agent's output, execution path, or cost.
Useful alerts combine trace data with production quality scores, then isolate the affected agent, model, environment, or workload. Percentiles, failure rates, and reviewed baselines help distinguish actionable regressions from normal variation, with every notification leading its owner back to the affected traces.
This guide follows the complete alerting workflow from instrumentation and online scoring through SQL conditions, Slack or webhook routing, and regression-case creation. Braintrust keeps each alert connected to the underlying traces, helping teams identify what changed and add confirmed failures to future evaluations.
Why AI agents need quality, cost, and latency alerts
Standard infrastructure monitoring tracks availability, status codes, and resource usage, and an agent can look healthy by all three while its answers lose accuracy, its runs cost more, and its responses take longer. Production LLM monitoring extends coverage to the signals generated by completed agent runs, and alerts notify the responsible team when those signals cross an accepted limit.
Quality regressions: A model update, prompt revision, or changed tool description can reduce factuality, task completion, or safety performance. The agent may still return a valid response with a successful status code, leaving production scores as the clearest signal that output quality has fallen.
Cost growth: Agents decide how many reasoning steps and tool calls to execute. A failing tool can trigger repeated attempts that add tokens and carry an expanding conversation history through every retry, increasing the cost of each affected request.
Latency degradation: Additional reasoning, sequential tool calls, and retries increase end-to-end response time. Time to first token can also rise when prompts become larger or model-provider performance changes, so both measurements need their own thresholds.
Quality, cost, and latency can move in different directions after the same change. Separate alert conditions keep an improvement in one metric from hiding a regression in another.
Instrument agent traces with alert-ready fields
Every alert condition filters trace data, so instrumentation sets the limit on which regressions you can detect and how precisely you can isolate the affected traffic. An alert can only query a field the trace already carries, which makes environment, model, prompt, agent, tool, and workload worth recording consistently from the first run.
Start by tracing model calls. Braintrust supports startup auto-instrumentation and explicit client wrapping. The following manual tracing setup initializes the logger and wraps the OpenAI client to record calls.
// Call once at startup — all LLM calls are traced automatically
initLogger({
  apiKey: process.env.BRAINTRUST_API_KEY,
  projectName: "My Project (TypeScript)",
});

// Wrap the OpenAI client to trace all calls
const client = wrapOpenAI(new OpenAI({ apiKey: process.env.OPENAI_API_KEY }));

const response = await client.responses.create({
  model: "gpt-5-mini",
  input: "What is the capital of France?",
});
Model-call tracing supplies inputs, outputs, token usage, cost, and timing information. Workload-specific fields come from the application and should be attached as structured metadata to the root span. The guide to tracing application logic shows how to record request-level fields such as the user and organization identifiers.
Keep the client wrapped here as well. logger.traced records the outer application span with your metadata on it, but the token, cost, and timing metrics that cost and latency alerts query come from the child LLM span, which only appears when the client is wrapped or when startup auto-instrumentation is active.
const logger = initLogger({ projectName: "My Project" });
const openai = wrapOpenAI(new OpenAI());

async function handleRequest(userId: string, orgId: string, prompt: string) {
  return logger.traced(
    async (span) => {
      const response = await openai.responses.create({
        model: "gpt-5-mini",
        input: prompt,
      });
      return response.output_text;
    },
    {
      event: {
        metadata: { userId, orgId },
        tags: ["handle-request"],
      },
    },
  );
}

await handleRequest("user-123", "org-456", "What is the capital of France?");
Plan the metadata around the alert conditions the team expects to create.
| Field | How it supports alerting |
|---|---|
| Quality scores | Detects declines in task success, factuality, safety, or other scored criteria |
| Cost and token usage | Identifies expensive traces, context growth, and repeated model calls |
| Duration and time to first token | Measures end-to-end waiting time and model-response delay |
| Model and prompt version | Connects a regression to the configuration that produced it |
| Agent, feature, and tool | Isolates the component or workload responsible for the change |
| User, session, organization, and customer tier | Shows which accounts or conversations are affected |
| Environment | Keeps production alerts separate from development and staging traffic |
Use the same field names and value formats across every agent. Record tool calls and orchestration steps as child spans so alert queries can measure per-tool errors, retries, and step counts across complete traces.
Generate quality signals with online scoring
Instrumented model calls provide cost and latency directly, and online scorers add the quality signal by evaluating production behavior against defined criteria. Braintrust online scoring runs asynchronously after traces are logged, so scoring does not add latency to the agent's response. Each result appears as a score span containing the value and supporting scorer data.
Choose scorers for specific failure modes
Start with the failures that would require action. Task-success scorers check whether the agent completed the request, factuality scorers assess grounding in the available context, and safety scorers detect policy violations. Code-based scorers work well for schemas, tool selections, and fixed business rules, with LLM-as-a-judge scorers handling semantic criteria such as relevance, helpfulness, or instruction adherence.
Select the scoring scope
| Scope | Suitable use |
|---|---|
| Span | Evaluate one model response, tool call, or agent step |
| Trace | Score the complete agent run with access to its nested spans |
| Group | Evaluate related traces together, such as a multi-turn session |
Choose the narrowest scope that includes all information the scorer needs. A tool-argument check may need one span, whereas task completion usually requires the complete trace. Group scoring requires a shared grouping key under metadata or span_attributes, such as metadata.session_id, to associate related traces.
Control scoring volume
Filter each rule to the traffic you actually need scored before applying a sampling rate. Braintrust recommends rates of 1% to 10% for high-volume applications and 50% to 100% for low-volume or critical workloads. The selected rate should still produce enough scored traces during each alert window to distinguish a regression from normal variation.
Once scores begin landing on production traces, alert conditions can query them alongside cost, token, timing, and error fields. Scored traces give quality alerts something measurable to fire on and keep each score attached to the execution that produced it.
Alert conditions that catch failures worth acting on
Braintrust log alerts evaluate SQL filters over incoming production logs. Each condition should identify the metric, threshold, and traffic segment that requires action. Separate conditions for quality, cost, latency, and execution failures make the triggering problem clear to the responder.
Score drops and quality regressions
Quality alerts watch the scores produced by online scoring. Set each threshold from a few weeks of reviewed production history, and confirm that traces below the selected value represent failures worth investigating. Scope the condition to the production environment so staging experiments never page anyone.
scores.factuality < 0.8 AND metadata.environment = 'production'
Cost spikes and token growth
Use a per-log cost condition to catch a single runaway trace caused by retries, tool loops, or excessive context. Set the threshold based on the normal upper range for the relevant agent, because acceptable cost can differ substantially between workloads.
estimated_cost() > 1.0
Track aggregate spend and average tokens per request on a dashboard. Rising input-token usage can reveal expanding context or repeated calls before the increase shows up on an invoice.
End-to-end latency and time to first token
Use metrics.duration to measure the complete trace and metrics.time_to_first_token for streaming model calls. Both are recorded in seconds, and metrics.time_to_first_token averages across the LLM spans in a trace. Review p95 and p99 values for the relevant agent and workload, then use those distributions to choose a per-log threshold. Time to first token isolates model startup delay, whereas total duration also includes tool calls, retries, and orchestration.
Create separate conditions for the two measurements so the alert indicates which part of the request slowed down.
Errors, retries, and runaway step counts
Detect provider timeouts, tool failures, and schema errors through the logged error field. Restrict the condition to production traffic and route the alert to the team responsible for the affected agent.
error IS NOT NULL AND metadata.environment = 'production'
Retries and step counts need explicit fields or consistent span structures. Log values such as retry_count and step_count as structured metadata, then set per-trace ceilings based on the agent's expected execution path. This catches loops and repeated actions before they create higher cost or latency regressions.
Segment alerts by agent, model, and workload
An alert across all production traffic can hide a serious regression in a smaller workload. For example, a support agent processing 50,000 daily requests can keep the overall factuality score stable even when a contract-analysis agent handling 500 requests declines sharply.
Create a separate alert segment when the traffic has its own quality baseline, operational owner, or business impact. Braintrust alert filters use structured fields such as agent, feature, model, prompt version, environment, customer tier, and tool. The Braintrust SQL reference covers the syntax for combining these dimensions.
| Segment | When it needs a separate condition |
|---|---|
| Agent or feature | Different workflows have distinct success criteria or owners |
| Model or prompt version | A deployment must be isolated from the existing production configuration |
| Environment | Production traffic should trigger different actions from staging or development |
| Customer tier | Contractual response-time or quality requirements differ |
| Tool | One external dependency has its own error rate or latency limit |
A model-specific condition can combine hard failures and a quality threshold in one filter:
metadata.model = 'gpt-4o'
  AND (error IS NOT NULL OR scores.accuracy < 0.8)
A workload filter can isolate a high-value feature and customer tier.
metadata.user_tier = 'enterprise'
  AND metadata.feature = 'summarization'
Segmented conditions can also use different thresholds. An enterprise workflow may require a tighter latency ceiling, and an experimental model may use a score floor based on its reviewed baseline.
Avoid creating alerts for every possible metadata combination. Start with segments that have different owners, limits, or consequences, and add narrower conditions when production evidence shows that an aggregate alert is missing important failures.
Calibrate alert thresholds with percentiles, rates, and baselines
A single slow trace or low score may fall within normal production variation. Use Braintrust dashboards to study distributions, error rates, and historical performance before converting a metric into an alert condition.
Which alert type you need follows from that. A log alert evaluates each incoming record against a SQL filter, so it fits conditions that are true of one trace: this run errored, this run cost more than a dollar, this run scored below the floor. A p95, an error rate, or an hourly cost burn is a property of a population rather than a record, and those belong in a Time window alert, which runs a scalar SQL calculation over a window and compares the result to a threshold.
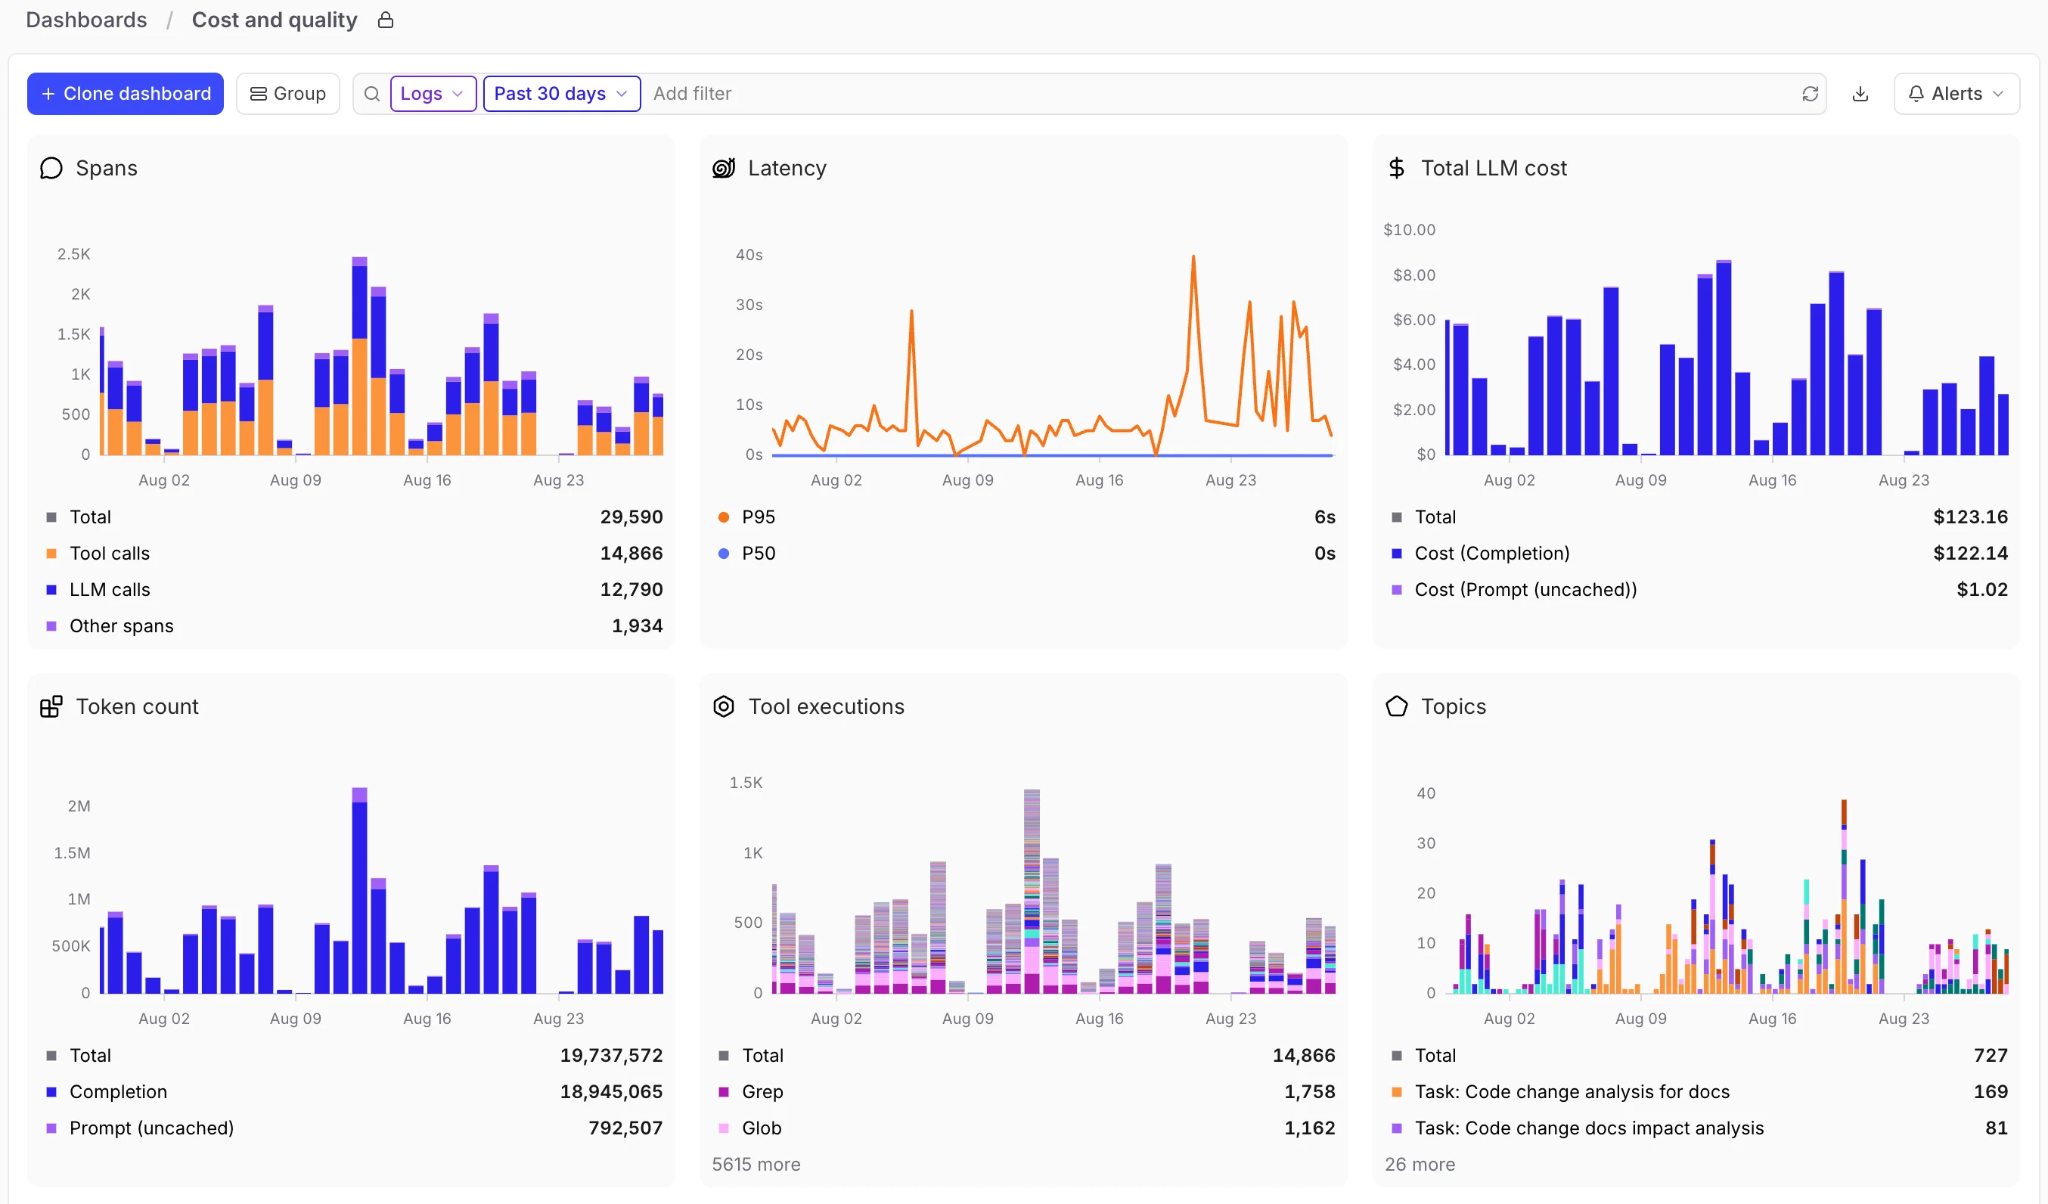
Percentiles: Review p95 and p99 latency for each agent or workload because averages can hide a small group of severely delayed requests. The distribution serves two purposes: it sets the duration that marks an individual trace as abnormal for a log alert, and it sets the threshold for a Time window alert that watches the percentile itself. Low-volume segments need enough observations before their percentile values become reliable.
Rates: Interpret errors relative to traffic volume. Ten failures across 100 requests require a different response from ten failures across 100,000 requests. A dashboard chart can calculate the percentage with a custom expression such as 100 * sum(errors) / count(id), and the same aggregate can become the calculation behind a Time window alert.
Alert on an aggregate with a Time window alert
Create the alert under Settings > Alerts, click Alert, and select Time window as the type. Configure the calculation with the builder or as raw SQL that returns a single value:
SELECT AVG(scores."Factuality") AS avg_score
FROM project_logs('<PROJECT_ID>')
WHERE scores."Factuality" IS NOT NULL
Set Window length (minutes) to the aggregation window and Alert trigger to the comparison, such as value is < 0.8. Advanced settings covers trigger delay, late-data handling, recovery notifications, the evaluation schedule, and renotification, which is where a sustained breach is distinguished from a single noisy window.
This alert type requires data plane v2.10.0 or later on self-hosted deployments. Where Time window does not appear in the type list, the fallback is the older pattern: run the aggregate as a scheduled SQL check outside Braintrust, or route a log alert to a webhook and let an external service aggregate before it pages anyone, as described in the knowledge base guide to sustained score alerts with external aggregation.
Notification intervals: Braintrust lets teams set a minimum interval between log-alert notifications from five minutes to 24 hours. The interval functions as a suppression period after an alert fires, and matching logs that arrive during that period do not generate another message. Choose an interval that limits repeated notifications without hiding a continuing incident.
Historical baselines: Review several normal traffic cycles before setting quality, cost, or latency limits. Segment the history by agent, model, workload, and environment so a high-volume service does not determine the baseline for every other agent. Recalculate the threshold after a prompt, model, tool, or orchestration change establishes a new normal range.
Record the data range and reasoning used for every threshold. This gives future reviewers a clear basis for deciding whether an alert needs recalibration when traffic patterns or agent behavior change.
Build SQL-backed alerts in Braintrust
A useful alert should take the responder directly from the notification to the affected traces. Build each condition from a filtered view that already isolates the behavior requiring attention.
1. Validate the filter against real logs
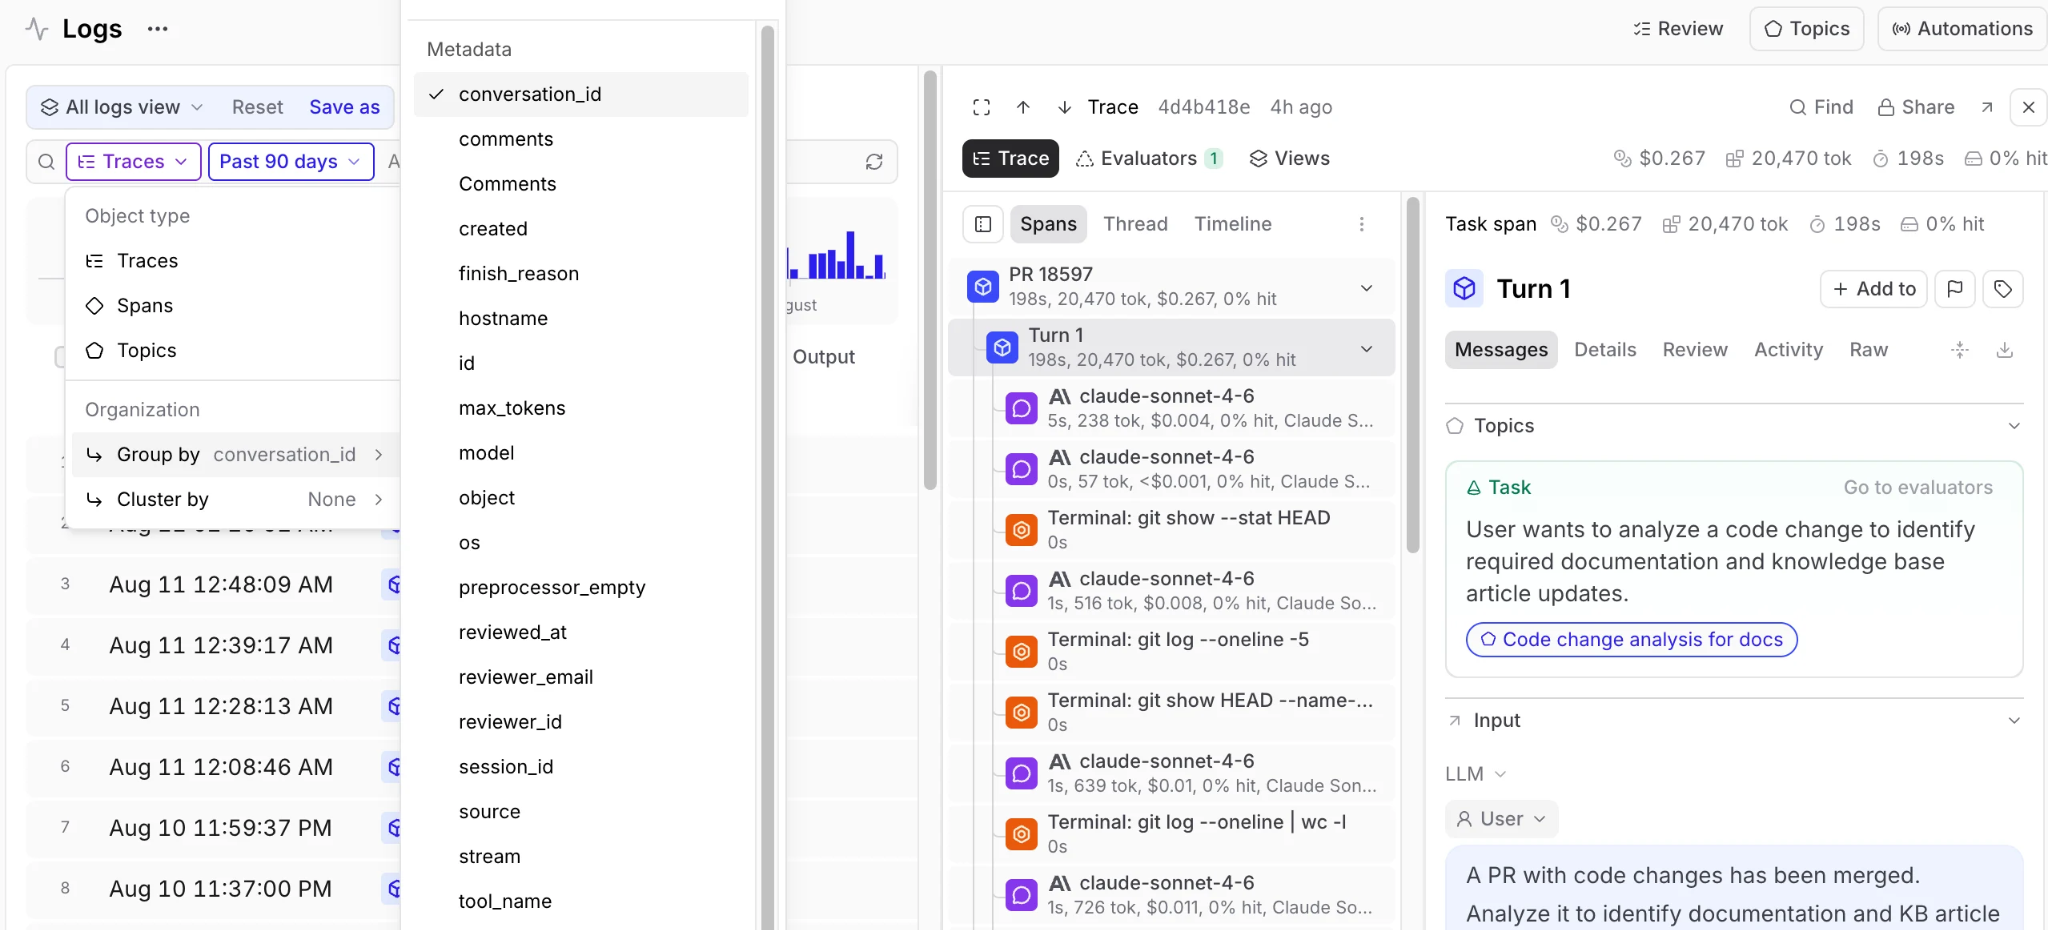
Open Braintrust Logs, select a representative time range, and filter down to the segment you want to alert on. Add the quality, cost, latency, or error condition you want to detect, then review several matching traces to confirm that each result warrants investigation.
2. Create the alert from the filtered view
From the Logs or Dashboards page, open the toolbar menu and select Create alert from filters. Braintrust transfers the active filters into the alert's SQL condition. Give the alert a descriptive name, configure its notification interval, and choose a Slack or webhook action.
You can also create an alert under Settings > Alerts by selecting the event type and entering the SQL directly, which is the path to take when the condition is a Time window aggregate rather than a per-record filter.
Creating an alert from a dashboard view transfers the filters that define the matching population. A chart's percentile or rate measure does not carry over as the condition, so read it as calibration: it tells you the threshold, which you then set on either a per-log filter or a Time window calculation.
3. Preserve the investigation path
Keep the condition specific enough that responders receive a manageable set of matching logs. Selecting a point on a dashboard chart opens the corresponding logs for that time range and series, where the responder can inspect the complete trace, including inputs, outputs, scores, timing, tool calls, and nested spans.
Route notifications to Slack and webhooks
Choose the destination based on who owns the response and what should happen after the alert fires. Slack works well for human investigation, and webhooks connect alerts to incident management or internal automation.
Slack for human triage: First, connect the Slack workspace under Settings > Integrations. When configuring the alert, select a channel from the searchable dropdown. Route each alert to the team responsible for that agent or workload so the notification reaches someone who can inspect the affected traces and act on the finding.
Webhooks for incident and automation tools: Enter a public HTTP or HTTPS endpoint to receive a JSON payload. Braintrust sends the organization, project, alert configuration, triggering message, timestamp range, matching-log count, and a URL to the related logs, which is enough for a ticketing or incident tool to open the investigation from the payload alone.
The webhook payload format and headers are fixed, so if the destination requires custom authentication headers or a different payload structure, use a lightweight service to transform and forward the request. Braintrust blocks delivery to private, internal, and reserved network addresses, which protects against server-side request forgery.
For either destination, use an alert name that identifies the agent, environment, segment, and condition. A responder should understand what triggered the notification and open the relevant logs without rebuilding the query.
Test, tune, and assign ownership
An alert is ready for production only after its condition, delivery path, and response process have been verified.
Test the delivery path: For a log alert that uses a webhook, click Test beside the webhook URL. Braintrust runs the SQL filter against recent logs and sends a sample payload when it finds matching records. Confirm that the receiving system accepts the payload, that the endpoint is reachable, and that the link to the related logs survives. Slack actions do not have the same built-in test, so verify the integration and channel permissions, then generate a controlled matching log to confirm delivery.
Tune with production evidence: Review the alert's matches during its first few days. Narrow the segment or adjust the score, cost, latency, or error threshold when normal activity keeps triggering it. Leave the notify interval alone unless the problem is notification frequency, since widening it suppresses messages without changing what the alert catches. Adjust one setting at a time so its effect remains clear.
Assign a clear owner: Give every alert to a named person or on-call rotation. Record the alert's purpose, the first log or dashboard view to inspect, the expected response, and the escalation path. Refine or retire alerts that repeatedly fire without leading to concrete action.
Convert confirmed failures into evaluation cases
A confirmed alert should improve future release coverage. After identifying the cause, add a representative trace to a dataset and capture the information required to reproduce and score the failure.
| Dataset field | What to capture |
|---|---|
input | The original request and any context required to reproduce the run |
expected | The approved output, behavior, or outcome |
metadata | The agent, model, environment, failure category, and relevant cost or latency values |
tags | Labels for filtering related regressions or assigning ownership |
Set expected to the corrected behavior. The failed production response can remain in metadata when it helps reviewers understand the regression. For cost or latency incidents, record the operating conditions and apply the accepted limit through a scorer.
Run the corrected agent against this case and the existing dataset to confirm that the fix resolves the failure without lowering other scores. Include the dataset in CI so future prompt, model, tool, or orchestration changes must meet the same quality and performance requirements before release. The guide to turning production failures into regression tests covers that promotion workflow in more detail.
Start alerting on your agents in Braintrust
Begin with one production failure that already has a clear owner and response, such as an error, a low quality score, an expensive run, or unacceptable latency. Filter the matching traces in Braintrust and create a log alert from that view. Route the notification to the responsible team, verify delivery, and tune the condition using production results. Once the alert is reliable, apply the same process to other agents and workloads.
Start free and create your first agent alert.
Frequently asked questions about AI agent alerts
What is the difference between LLM monitoring and LLM alerting?
LLM monitoring provides ongoing visibility into production behavior through logs, traces, scores, costs, and performance trends. Alerting evaluates incoming activity against defined conditions and contacts the responsible team when a result requires attention. Teams use monitoring to understand an issue and alerting to begin the response at the right time.
How do you measure AI agent quality in production without ground truth labels?
Combine LLM-as-a-judge scoring with deterministic checks, tool-call outcomes, user feedback, and downstream task completion. Periodic human review helps confirm that automated scores reflect expert judgment. Delayed signals such as resolved support cases or completed transactions can provide stronger labels later.
What latency metrics matter most for AI agents?
End-to-end duration and time to first token are the headline numbers, and both deserve a per-workload ceiling. Interactive agents and background jobs need different ones, since 30 seconds is unacceptable in a chat window and unremarkable in a nightly pipeline. Giving retrieval, each tool call, and the final generation its own share of that budget turns a slow trace into a specific overrun, so the responder knows which step to open.
How do you prevent alert fatigue for AI agent metrics?
Alert fatigue is usually a precision problem, so track what share of each alert's notifications led to an actual change and delete the ones that never do. Conditions that need a human immediately belong in a Slack channel, and the rest can go to a daily digest through a webhook, which keeps lower-severity signal visible without interrupting anyone.
Which notification channels does Braintrust support for alerts?
Braintrust log alerts can notify a Slack channel or send a webhook to a public HTTP or HTTPS endpoint. Slack supports direct team triage, and webhooks can pass the alert into incident management, ticketing, or automation systems. Webhook delivery uses a fixed JSON payload.
When should an alert become an evaluation case?
Convert an alert into an evaluation case after the investigation confirms a reproducible application failure that a future change could reintroduce. Examples include an incorrect response, a failed tool decision, or a cost or latency breach caused by the agent configuration. A temporary provider or network incident belongs in operational history unless it reveals behavior the application should handle more reliably.